The UK has been experiencing above-average seasonal temperatures over the last few years. In July 2022, the UK saw the air temperature at London’s Heathrow Airport soar to 40.2°C. You may be surprised to learn that the land surface temperature was even hotter?
On the 18th and 19th of July 2022, National Centre for Earth Observation (NCEO) scientists mapped land surface temperature across the UK, using satellite data, to record new record highs of 48°C. Land surface temperature is a separate measure to ambient air temperature, but the two are fundamentally linked. The heat rising off Earth’s landscapes influences and is influenced by, our world’s weather and climate patterns.
In a project backed by the UK Space Agency, the National Centre for Earth Observation (NCEO) is collaborating with Ordnance Survey (OS) using satellite data to monitor and map heat in locations at greatest risk. The aim is to provide meaningful insights for policymakers to manage the impacts of climate change in hot spots across the UK and further afield.
Dr Darren Ghent, NCEO Leader and Research Fellow for Land Surface Temperature, said:
“Satellite observations of land surface temperatures, and their change, are increasingly recognised as being able to provide unique and detailed knowledge to better facilitate the understanding of climate change and thus to inform planning and ‘climate-adaptive’ policies to deal with extreme events, such as heatwaves.”
A recent report by Ordnance Survey showed that heat-related disasters have high economic costs, estimated to be between £323 million to £9.9 billion per year by the 2050s. The effects of climate change are not just the rise in global temperatures but the extreme weather events that occur such as droughts, floods, and heatwaves. Record-breaking heatwave events in the next decade are more than likely.
Using satellites to map ground heat
Watch this video which helps explain how NCEO and Ordnance Survey are using satellites to map land surface temperature to monitor and map locations at greatest risk from heatwaves.
Listen to the Ordnance Survey podcast that helps to explain how NCEO and OS are using satellites to map land surface temperature to monitor and map locations at greatest risk from heatwaves.
Adding Ordnance Survey mapping to give location and context
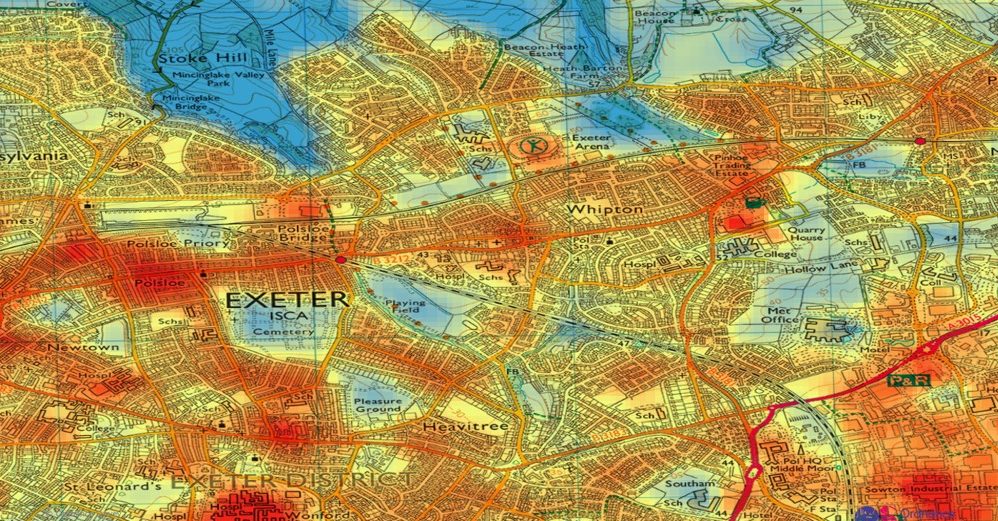
NCEO land surface temperature heat map, which has been integrated with an Ordnance Survey street map, to provide enhanced information for users. Image: NCEO LST data integrated with OS topography.
Mark Tabor, Ordnance Survey Principal Production Consultant, said; “On its own Earth observation has no context but add a map and suddenly it has the context to shape change, as evidenced by the UK Space Agency project. Making the combined data set easily accessible with our technical expertise can lead to informed decisions and help protect the most vulnerable communities, infrastructure and environments, and enable the success of climate solutions to be monitored and best practice shared.”
Science and data into policy change
The Earth observation data will use land surface temperature data from thermal infrared sensors in space. This will reveal locations that may show greater risk to human health and enable better planning and ‘climate-adaptive’ policies to deal with extreme weather events.
Donna Lyndsay, Ordnance Survey Innovation Lead, said: “Geospatial data is already supporting how we respond to climate change and the drive towards net-zero. By working collaboratively with the UK Space Agency and leading scientists, OS is using its mapping capabilities and trusted data to identify areas at greatest risk from global warming.
“Sifting through data can be a minefield and so it’s our mission to empower public bodies to meet their climate action plans with meaningful insights and evidence, ensuring high quality scientific data is in the hands of the right people. With heat events becoming more regular, and more intense around the globe, the demand for Earth observation and geospatial data is likely to grow in 2023 as both datasets are vital to reducing the effects of climate change. ”
Data from the project will deliver insight so that governments will be able to protect vulnerable communities by identifying cool spaces or areas where safe zones are needed, optimise tree planting, and explore how planning could mitigate risk and ensure the land management measures being proposed will be resilient to future change, from urban planning to rural planning, and protecting our people, livestock, and crops.

In cities, urban heat islands occur where the land surface is densely covered with roads, pavement, buildings, and other surfaces that absorb and retain heat. This effect increases energy costs, air pollution levels, and heat-related illnesses and fatalities. Using geospatial data, planners will be able to identify suitable buildings that require adaption, such as retrofitting green or cool roofs, and greenspaces which could be used for heat pumps and as low-carbon heat sources to help the UK achieve its climate targets.