

News and Media
Summer of Wildfires: 2026
Dr Richard Pope and Dr Ailish Graham – NCEO Leeds

The Northern Hemisphere has experienced extensive wildfire activity this summer including the largest wildfires ever experienced in Spain (near Madrid) and the most intense in France since the Second World War (near Bordeaux). Extreme Canadian fires in Yellowknife (British Columbia) and Western Ontario generated massive wildfire smoke plumes which propagated over the Eastern US (notably New York). In the UK, relatively large-scale fires occurred across the country including the Peak District, Conwy (North Wales), the Cairngorms (Scotland) and Dunwich Heath (Suffolk). The latter wildfire caused considerable concern given its proximity (~5-6 km) to the nuclear power station, Sizewell B. Here, satellite Earth observations (EO) have played a critical role in tracking the extent and impact these fires, which have had a very high profile in the news. This article discusses several major wildfire events we have investigated using EO and surface pollutant data and summarises some of our many interactions with the media during this period.
Record-breaking heatwaves and worsening drought conditions, attributed to human‑driven climate change, have gripped large parts of Europe and North America during the summer. Europe has experienced 4 separate heatwaves, and, in England, the Environment Agency has officially declared droughts across half the country. Frequent blocking, high-pressure systems have suppressed frontal systems and related precipitation, yielding extremely dry conditions (>3 °C higher temperatures over Europe on average) and much of the surface vegetation is desiccated, creating highly flammable fuel loads and large fire risks. The fire burnt area across the EU resulting from the fires has been 50-100% larger (>400 kha) than the seasonal average (200 kha) in late July / early August.
In North America, Western Ontario wildfires (13th-18th July) generated huge spoke plumes transporting hazardous air pollutants across large US cities such as New York.
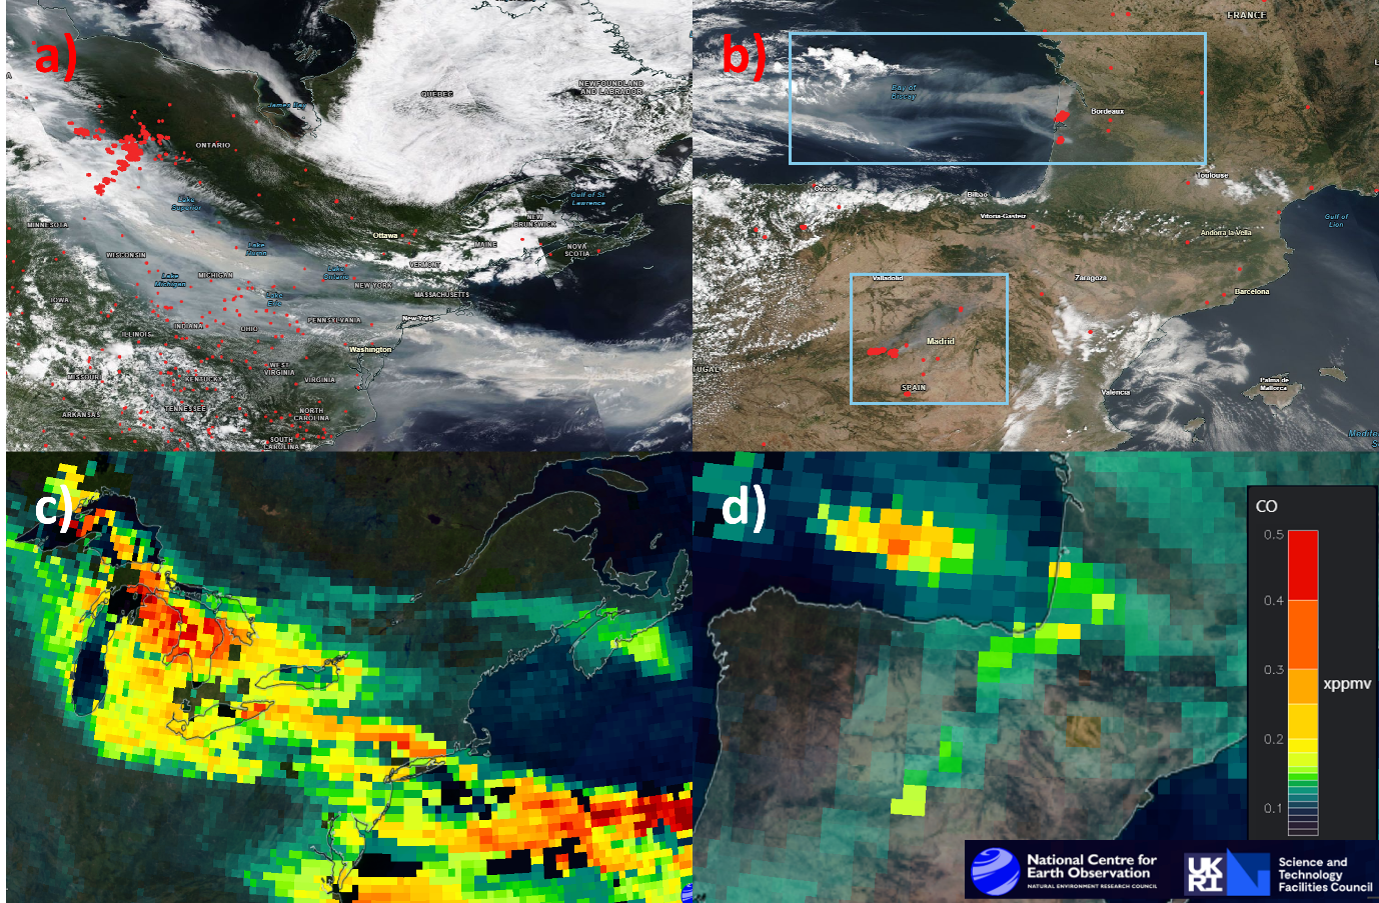
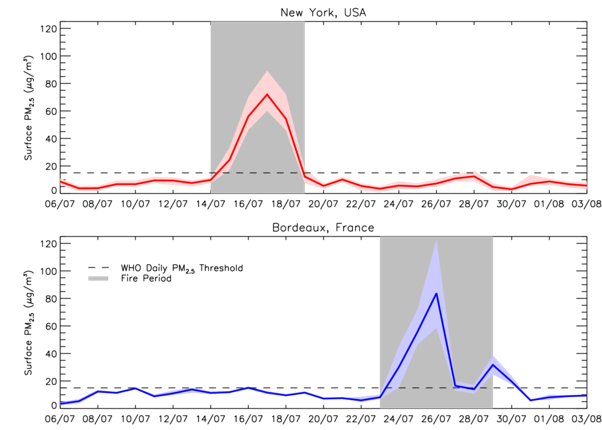
Figure 1a below shows satellite imagery of fire hotspot clusters (red dots) in Ontario and the corresponding spoke plume propagating over the US Eastern Seaboard. Retrievals of carbon monoxide (an air pollutant emitted by smouldering fires) from the Infrared Atmospheric Sounding Interferometer (IASI) instrument onboard the MetOp-C satellite, developed by NCEO RAL Space, show dramatic pollutant plumes coinciding with the smoke in the visible imagery (Figure 1c), as discussed by Richard Pope with the Associate Press. Investigation of surface air quality monitoring stations in the New York area (10 stations) showed that daily average surface particulate matter (PM2.5 – aerosols with a diameter <2.5 microns) peaked at approximately 75 µg/m3 (Figure 2) in the fire exposure period (14th-19th July). These measured concentrations are 5 times the daily average exposure safety guidelines of 15 µg/m3 given by the World Health Organization (WHO).
Over continental Europe from 23rd-30th July, severe wildfires broke out approximately 9 km and 80 km from Bordeaux and Madrid, respectively (Figure 1b – light blue boxes). Visible imagery revealed detectable smoke plumes originating from both fires. For the Bordeaux fires, a sizable carbon monoxide plume propagated out over the Bay of Biscay (Figure 1d – 24th July). Similarly, but less defined, plumes flow north-eastwards from the Madrid fires. The synoptic conditions typically yielded low-moderate windspeeds (5-10 mph), which generally transported wildfire smoke away from Madrid, meaning the pollutant exposure was more limited. However, residents of Bordeaux were likely exposed to peak PM2.5 concentrations of approximately 85 µg/m3 (Figure 2), nearly 6 times the WHO threshold as discussed by Richard Pope with CNN and Ailish Graham on Greatest Hits Radio – West Yorkshire.
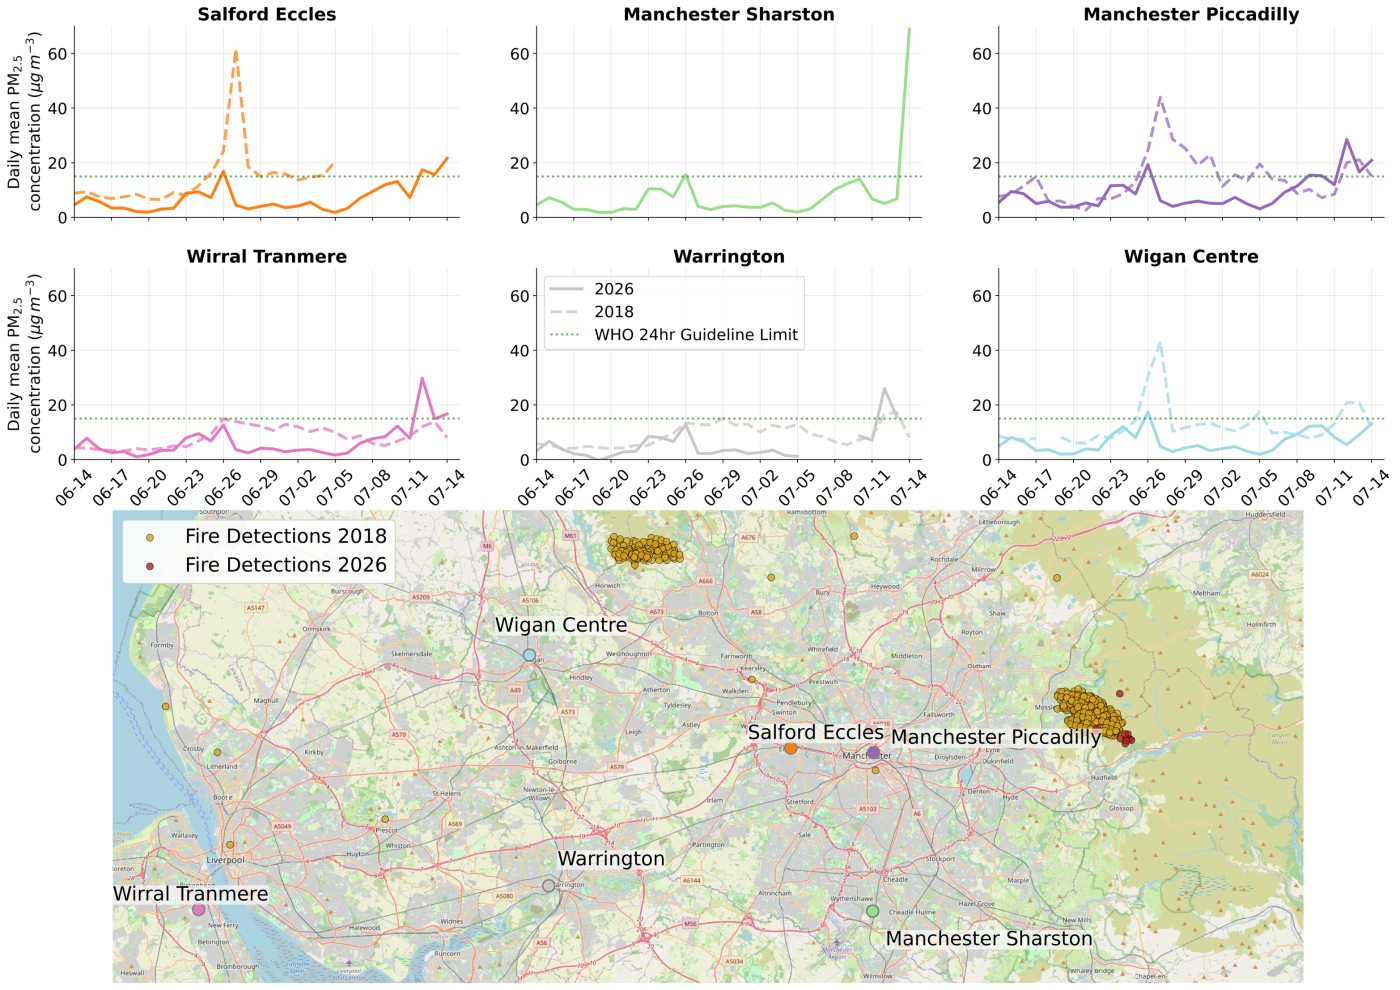
In the UK, the Dunwich Heath fire (29th July – 1st August) received the most media attention given its proximity (< 6 km) to the Sizewell B nuclear power station in Suffolk. The fires burn scar peaked at approximately 1 km2, which was small compared to the June 2018 Saddleworth Moor fires (18 km2). However, the Dunwich Health fire caused extensive damage to local heathland ecosystem and biodiversity which will take several decades to recover. The UK wildfires with the biggest impacts this summer were at Tintwistle Moor, near Glossop, yielding a burn scar of ~6 km2 and smoke plumes that propagated towards Greater Manchester, as described by Ailish Graham and Richard Pope for the Science Media Centre.
Figure 3 shows a map of the surface monitoring sites in Northwest England and their response in PM2.5concentrations from the Dove Stone and Swineshaw wildfires. In June/July 2018, the Saddleworth Moor and Winter Hill fires caused large spikes in daily PM2.5 concentrations (40-60 µg/m3) in urban centres like Manchester, Wigan and Salford. However, the Dove Stone and Swineshaw wildfires did not yield the same pollution impact, despite occurring in a similar location. This difference in impact was driven by contrasting wind directions between 2018 and 2026. During the 2018 Saddleworth Moor wildfire, smoke was blown west, passing directly over Manchester Piccadilly and Salford Eccles, with PM2.5 concentrations peaking at >40-60 µg/m3. In contrast, during the 2026 Dove Stone wildfire, wind blew the smoke in a south-westerly direction from the moor. This meant smoke skimmed the south-west of Greater Manchester, rather than passing directly over the city centre. This can be seen from the Manchester Sharston site where PM2.5 concentrations reached >60 µg/m3. The plume then dispersed over Warrington and the Wirral (20-30 µg/m3). While Manchester Piccadilly (central Manchester) experienced smaller enhancements up to ~25 µg/m3. Consequently, the difference in wind direction meant the number of people exposed to smoke from the Saddleworth Moor fire was much larger than to smoke from the Dove Stone fire.
For the rest of the summer (August and September), the European Centre for Medium-Range Weather Forecasting (ECMWF) sub-seasonal forecasts suggest higher than average temperatures. Peak daily temperature will likely remain well above 30 °C for much of continental Europe, which is reflected in ECMWF’s Fire Danger Forecasts with “extreme” or “very extreme” risks of wildfires across the UK and continental Europe in mid-August.
Beyond the Summer 2026, a warming climate and land-use change means that the frequency and intensity of wildfires across the UK and Europe is likely to increase substantially. Therefore, existing satellite platforms (e.g. Figure 1) and new geostationary capabilities will be crucial to help aid the monitoring of wildfires and smoke plumes, as well as providing key data sets for nowcasting using machine learning and more conventional approaches.
Share this article


Published by Fazila Patel
Digital Comms Officer
University of Leicester
Latest News and Events
