A new paper that analysis inter-annual variations of SIF over the US Corn Belt has been published.
Remotely-sensed solar-induced chlorophyll fluorescence (SIF) provides a means to assess vegetation productivity in a more direct way than via the greenness of leaves. SIF is produced by plants alongside photosynthesis so it is generally thought to provide a more direct probe of plant status.
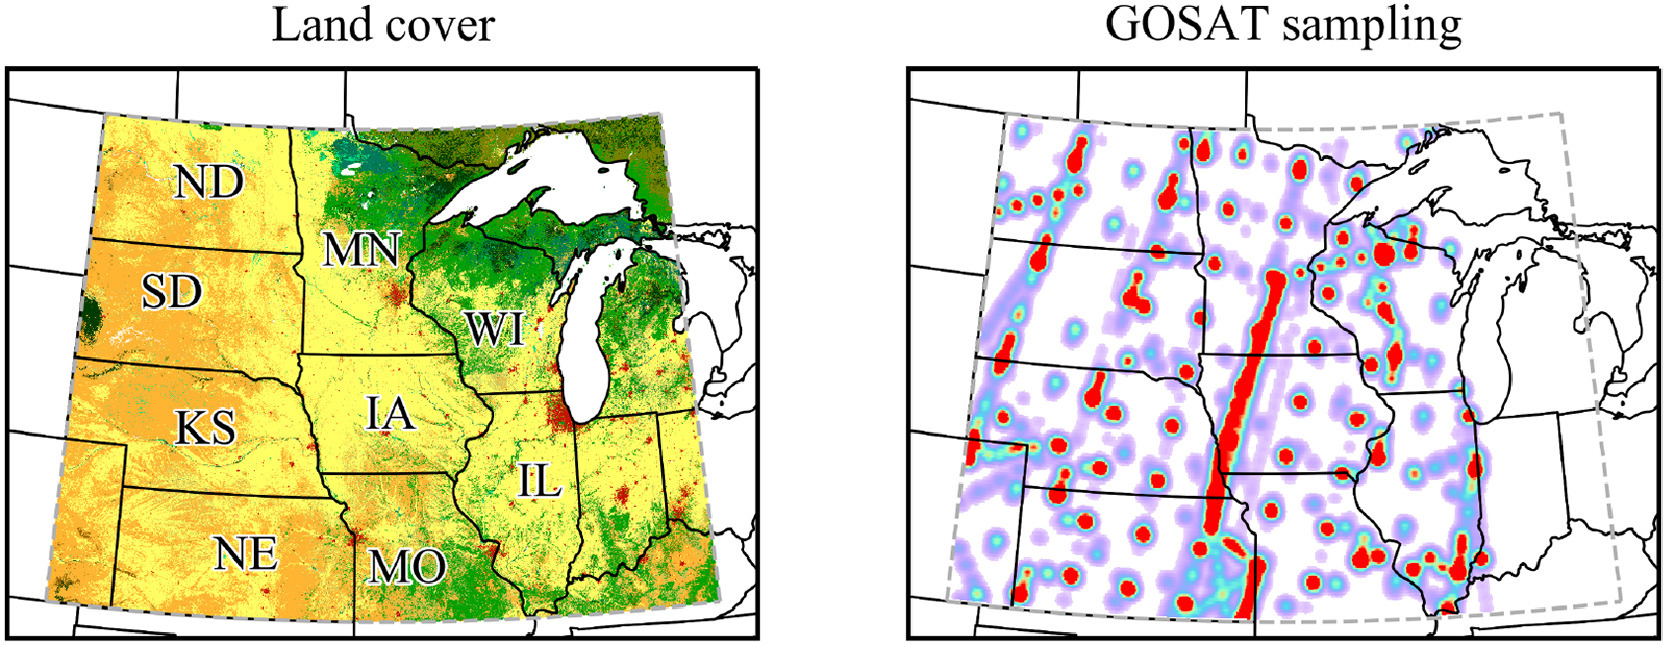
The paper looks at the inter-annual variations of SIF over the US Corn Belt using a seven-year time series (2010–2016) retrieved from measurements of short-wave IR radiation collected by the Japanese Greenhouse gases Observing SATellite (GOSAT).
Using survey data and annual reports from the US Department of Agriculture (USDA) National Agricultural Statistics Service (NASS), the researchers relate anomalies in the GOSAT SIF time series to meteorological and climatic events that affected planting or growing seasons. The events described in the USDA annual reports are confirmed using remote sensing-based data, such as land surface temperature, precipitation, water storage anomalies and soil moisture. These datasets were carefully collocated with the GOSAT footprints on a sub-pixel basis to remove any effect that could occur due to different sampling.
It was found that the cumulative SIF, integrated from April to June, tracks the planting progress established in the first half of the planting season (Pearson correlation r > 0.89). Similarly, crop yields for corn (maize) and soybeans are equally well correlated to the integrated SIF from July to October (r > 0.86).
The results for SIF were consistent with reflectance-based vegetation indices, that have a longer established history of crop monitoring. Despite GOSAT’s sparse sampling, the researchers were able to show the potential for using satellite-based SIF to study agriculturally-managed vegetation.
To view the full paper click here
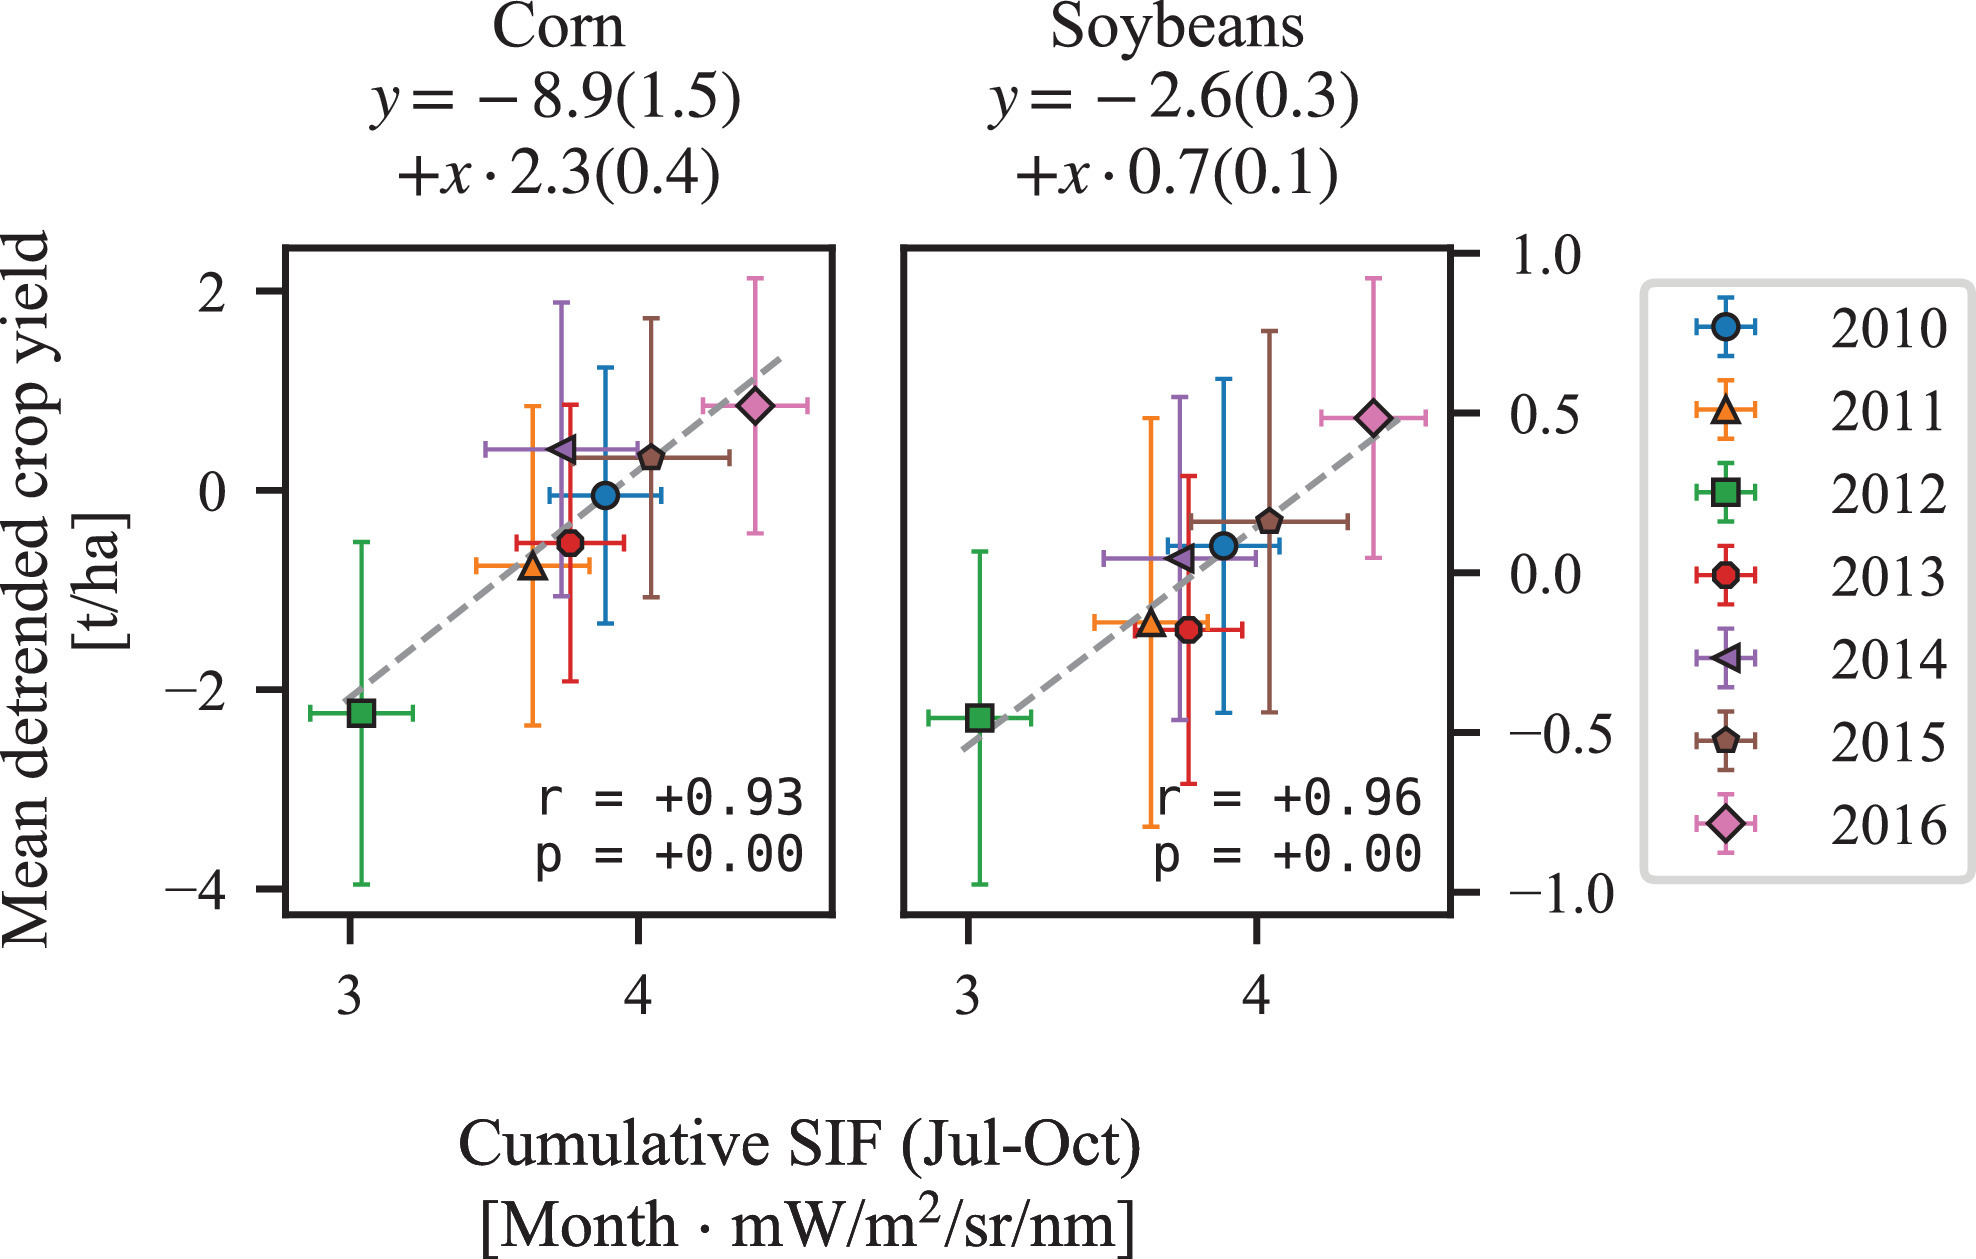
Annual crop yield from June to October as a function of the time-integrated monthly SIF radiances from July to October.