In an article in Geoconnexion, NCEO’s Mathias Disney describes how a lightweight laser scanner measures small-scale topography in a forest – to further our knowledge of greenhouse gas emissions.
Using a newly-acquired ZEB-Revo lightweight revolving laser scanner, Mat Disney and his team of Phil Wilkes, Andy Burt, and student Darcy Glenn (all UCL) visited Harwood Forest in Northumberland to scan the forest.
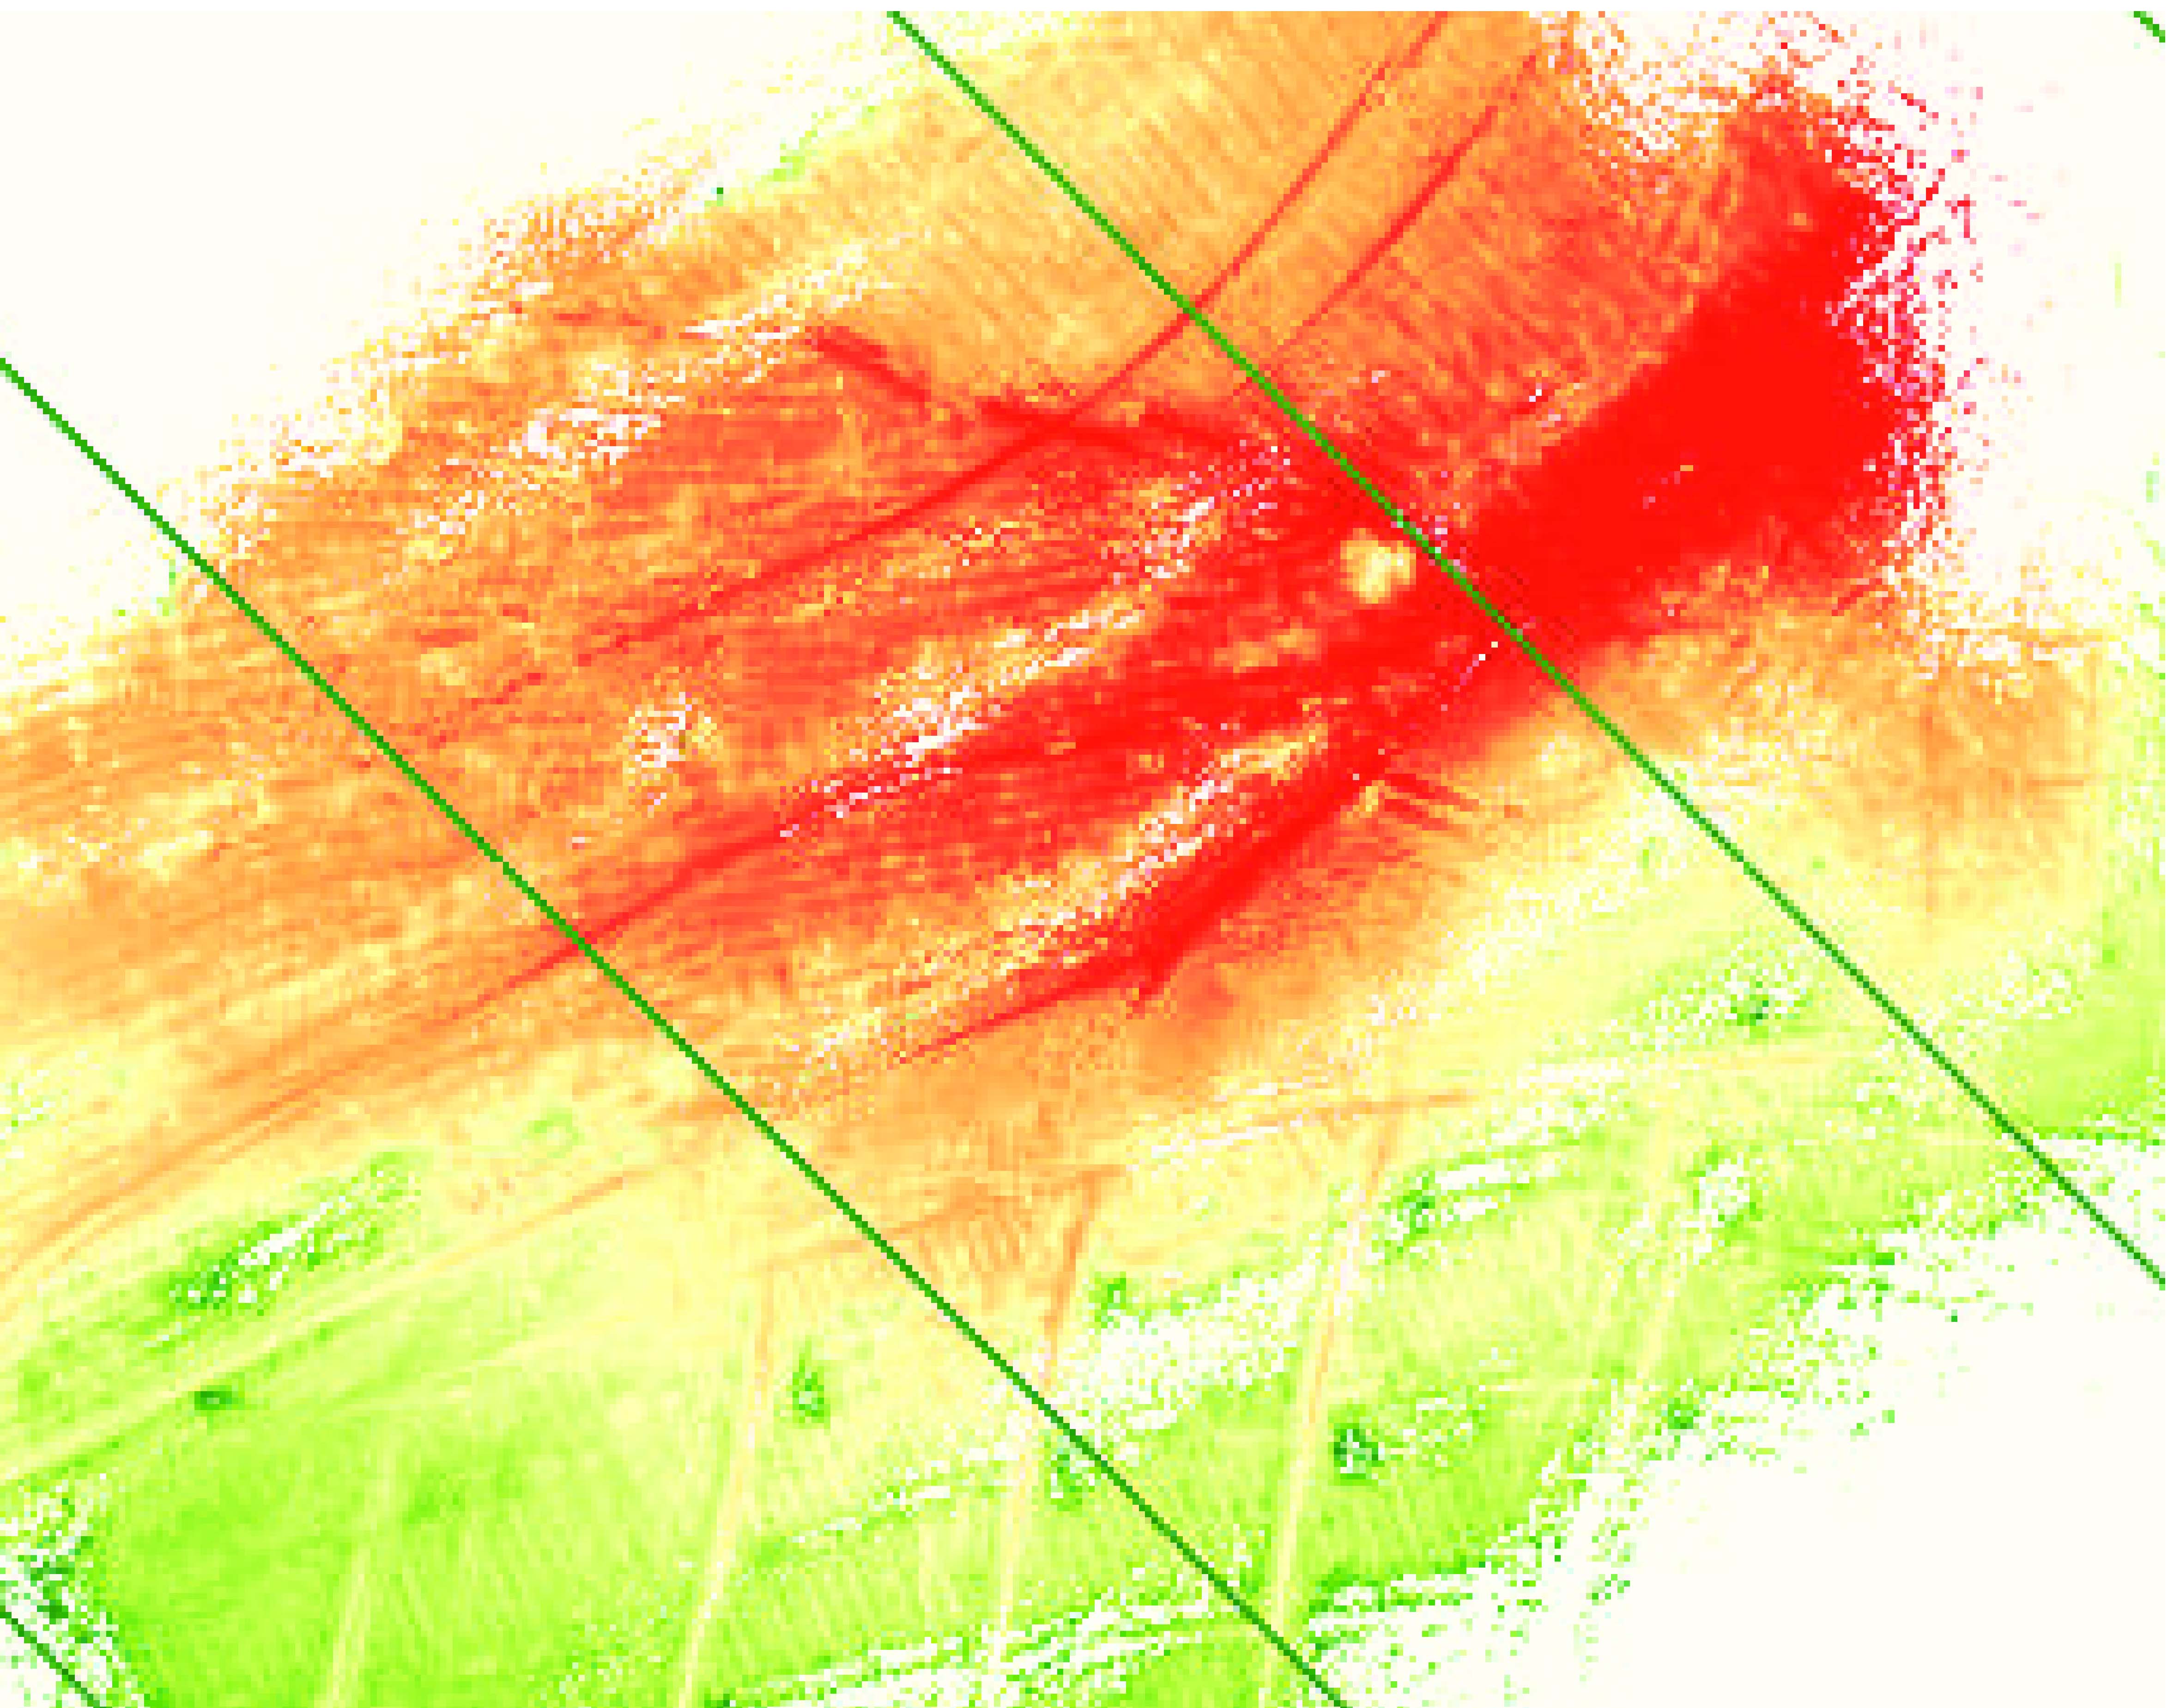
Digital Elevation Model of Harwood Forest using ZEB-Revo scanner
Their work is part of a project funded by the Natural Environment Research Council (NERC) called “GREENHOUSE” (Generating Regional Emissions Estimates with a Novel Hierarchy of Observations and Upscaled Simulation Experiments) led by NCEO and University of Edinburgh’s Professor Mat Williams. The aim of the project is to estimate Britain’s biogenic greenhouse gas emissions using a wide range and scale of measurements.
The figure above is the first Digital Elevation Model produced across the Harwood Forest site using the ZEB-Revo scanner. Green to red represents height from low to high values. The site drops slowly from bottom to top, and the small river valley is clear on the upper right. The artifician ridges produced by planting are also evident in the lower part of the image. This sort of detail is fundamental in getting the CH4 budget right, but would be extremely difficult and time-consuming to measure in any other way than with a small, portable Terrestrial Laser Scanner.
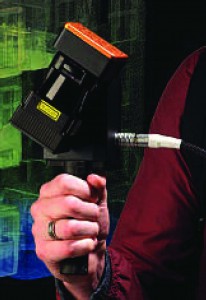
ZEB-Revo laser scanner picture copyright Phil Wilkes NCEO