The TROPOMI instrument on Sentinel 5-P gives better readings of Nitrogen Dioxide
By Dr Richard Pope, NCEO Leeds
New state-of-the-art satellite measurements of tropospheric column NO2 (TCNO2) from the TROPOMI instrument, on-board Sentinel 5 – Precursor (S5P) launched in October 2017, allow for the unprecedented high resolution (sub-10 km) assessment of UK air quality (AQ) from space. The Ozone Monitoring Instrument (OMI), predecessor to TROPOMI, has a horizontal resolution of 13 km x 24 km, while TROPOMI can monitor NO2 source regions at a resolution of 3.5 km × 7 km.
Surface monitoring stations (i.e. the Automated Urban and Rural Network – AURN) provide important information on local AQ at hourly time intervals. However, the limited spatial coverage of the network struggles to be representative of widespread pollution given the strong gradients in surface emissions and complex meteorology. Here satellite measurements can provide critical information on UK pollution sources/hotspots, detect hazardous pollution episodes and monitor changes in time (e.g. has government policy helped to reduce levels of pollution).
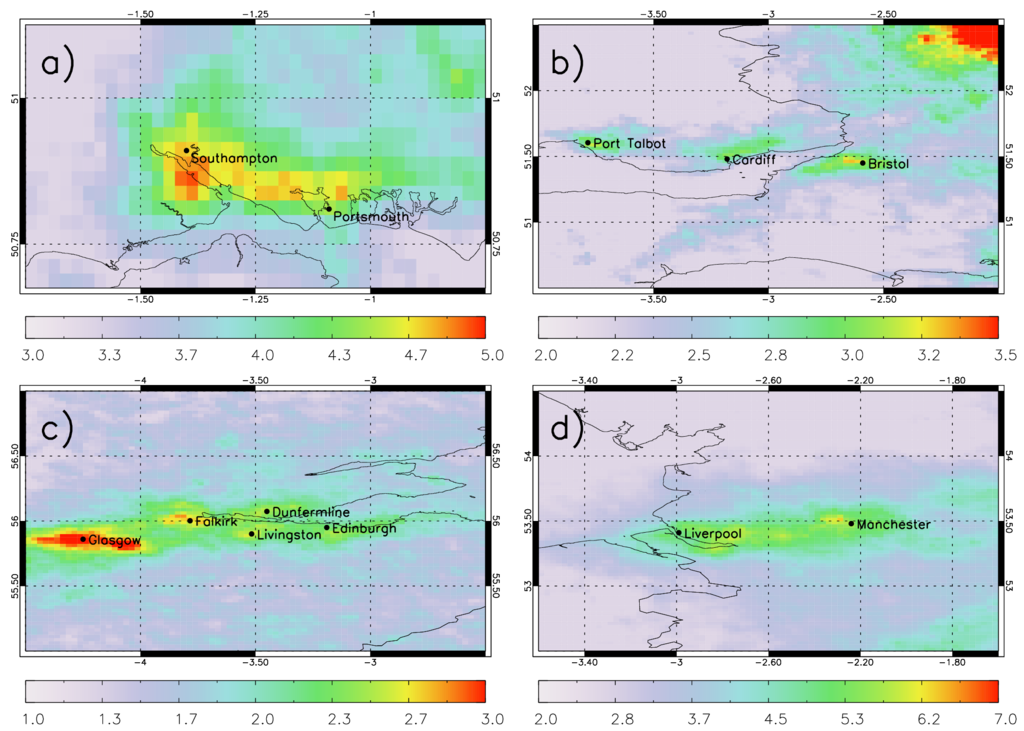
Figure 1: TROPOMI TCNO2 (1015 molecules/cm2) for JJA in 2018 for the UK regions: a) Hampshire, b) West Country - South Wales, c) Central Scotland and d) Greater Manchester-Merseyside. Note the difference in spatial scale between panel a) and panels b)-d).
Figure 1 focusses on Hampshire, West Country-South Wales, Central Scotland and Greater Manchester-Merseyside, where the superior TROPOMI resolution reveals sources previously undetectable by satellite. Over Hampshire (Figure 1a), there is a clear gradient between the Southampton-Portsmouth conurbations and surrounding area. Peak TCNO2 is located over Southampton and the coastline along the Solent estuary where shipping emissions of nitrogen oxides (NOx) are high.
Over the West County and South Wales (Figure 1b), three clear hotspots exist over Bristol, Cardiff and Port Talbot. TROPOMI reveals a clear signal in NO2 attributable to pollution from emissions in Bristol, the major motorway network (M5 and M4) and shipping activity at Avonmouth, which are strongly correlated with the UK NOx emissions inventory. On the opposite side of the River Severn, the Cardiff, Newport and Port Talbot (high shipping activity) signals can also be detected. In Central Scotland (Figure 1c), the TCNO2 signal is weaker and noisier, but clear hotspots still exist over Glasgow, Edinburgh, Falkirk, Livingston, Dunfermline and the Forth Estuary.
OMI has been shown to detect elevated TCNO2 over Manchester, but no clear hotspot over Merseyside. However, in Figure 1d, TROPOMI identifies two separate hotspots over both regions as well as pollution from other smaller cities/towns (e.g. Wigan and Warrington) and motorways (e.g. M62 and M6) between them. Again, the TCNO2 hotspots correlate well spatially with NOx emission inventories.
This work has been published online in RMetSoc Weather